Last updated on December 25, 2023 4:52 am
Bitcoin BTC Technical Analysis: Bulls Seeking Support Above $42,230, December 25, 2023
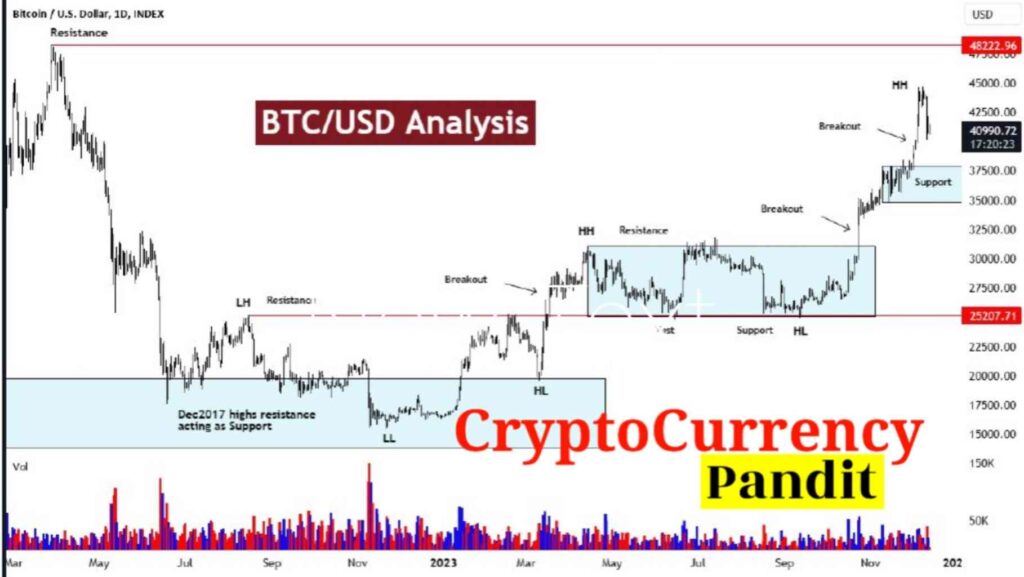
As shown in the monthly chart, the highs of 2017 proved to be a formidable barrier. In 2022, however, once this level was removed, it began to function as a support. Operating under the fundamental premise that an enemy, once neutralized, will begin to provide support.

25th December: Bitcoin BTC Technical Analysis
As the Bitcoin/USD pair kept trading above the $42,230 region, which represents the half retracement of the depreciating range from the all-time high of $69,000 to $15,460, recent gains by bulls in the Bitcoin/USD market have sent the pair over the $43,333.35 level, marking a potential upward price target associated with buying pressure at the $25,983.78 range. Technically, the recent upswing at 42575 tested the half-retracement of the declining range between 45000 and 40150.
A price objective linked to prior price increases around the 3858 area, the 45278. Near the 45,000 mark, the most recent multi-month high, the 22 level was challenged. When prices surpass the market, which comprises the 46105, 46487, and 49161 levels, stops are specified.
Bearish Targets of BTC Technical Analysis

Additional negative price targets between 40185 and 38773 indicate that downside dangers below the market are still present. Given the current selling pressure around the 44754 and 44049 regions, the 41458.35 level is a downside price goal that was picked because of recent profit-taking action. Levels around or around 38998, 38028, 37321, and 35285 might be the site of some buying pressure and technical support. The 50-bar moving average (4-hourly) is showing negative signals below the 100-bar moving average (4-hourly) and above the 200-bar moving average, according to traders (4-hourly). Additionally, the 50-bar MA (hourly) is showing signs of bullishness above both the 100-bar MA (hourly) and the 200-bar MA (hourly).
With stops expected below, technical support is anticipated at $37,392.45, 36720.55, and 35633.00.
With stops anticipated above, technical resistance is anticipated at 46487.10, 47108.16, or 48240.00.
The 4-hourly chart shows a bullish trend for SlowK above SlowD and a bearish trend for MACD below MACD Average.
Bullishness exists on the 60-minute chart for SlowK above SlowD and bullishness exists on the MACD above MACD Average.
On the hourly chart of the BTC/USD pair, a new upward trendline is formed, connecting with the support level near 43,100 USD. Profits need to be increased in light of the present price action and new developments.
Here, I’d like to go over three possible outcomes for various types of traders:
- Overtly Bullish
- Moderately bullish
- Cautiously bullish
🚀Overtly Bullish-
For those just planning to trade in the short term, this is the best-case situation right now. Once the shakeout is over, the market will start rising again. Near the 40000–40100 zone, with a halt below this zone, there is a wholesale entry. Possible short-term targets are 44,500 and 48,200.
🚀Moderately Bullish
According to this scenario, we are anticipating further setbacks since we have strained too far. For those with an intermediate-term view, this situation is ideal. From there, a bounce play might be possible if 38000 (the prior resistance) acts as support. With a goal of 44,500 or above and a stop-loss level below 38,000.
🚀Cautiously Bullish
If you’re in it for the long haul, BTC Technical Analysis, this market situation is for you. While waiting for deeper corrections, they would disregard entries close to the higher prices. If they are correct, additional buyers will enter the market in the breakout zone of October 2023, which might occur between 35000 and 33400.
Where do you fall on the spectrum of BTC technical analysis?
Leave a comment in the comment section below.
Please note that CCP's BTC technical analysis is being offered by an outside source and is intended solely for informative purposes. Not intended for use as investing, tax, legal, or financial advice; does not represent Cryptocurrency Pandit Opinion.


Be First to Comment